
| Price | $70,166.90 (▲ +1.73% 24h) |
| 24h High | $71,768 |
| 24h Low | $68,347 |
| EMA 20 | $69,103 |
| EMA 50 | $68,692 |
| EMA 200 | $70,482 |
| EMA Alignment | Mixed |
| Funding /8h | -0.0095% — Shorts paying Longs |
| OI Trend | Rising (+2.9%) |
| Fear & Greed | 13 – Extreme Fear (yesterday: 8 – Extreme Fear) |
Trend Analysis
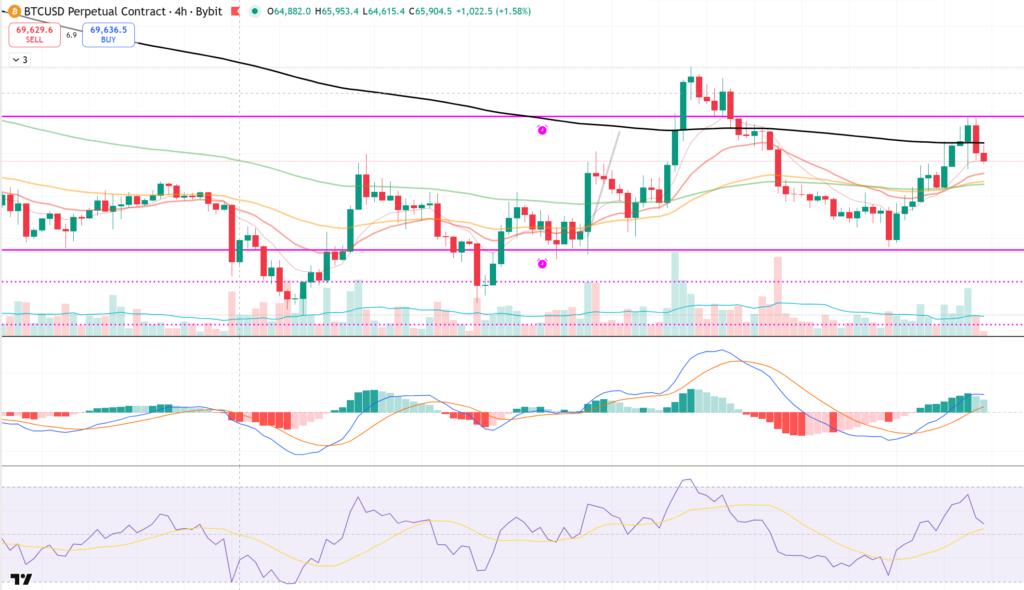
- Short-term uptrend intact: Price rallied ~$5,200 from the $65,571 swing low (Mar 8) to the $71,767 high (Mar 10), now consolidating around $70,167 after a pullback from the session high.
- EMA stack is bullish: EMA 20 ($69,103) > EMA 50 ($68,692), with price trading above both; however, price sits just below EMA 200 ($70,482), which is acting as overhead resistance.
- Momentum mixed: RSI at 57.72 confirms bullish bias but MACD histogram is decreasing (349.9), signaling fading upside momentum after the bullish crossover — potential for consolidation or pullback.
EMA Analysis
- EMA 200 ($70,482) is the critical level: Price is trading $315 below it — a decisive close above flips it to support and opens upside; rejection here favors a retest of lower EMAs.
- EMA 20 ($69,103) and EMA 50 ($68,692) are clustered ~$400 apart, providing a strong dynamic support zone on any pullback; a break below $68,692 would negate the bullish structure.
- No bearish EMA crossover imminent: The 20/50 spread is widening bullishly, but a failure at the 200 EMA could compress them back toward a flattening over the next 2-3 days.
Support and Resistance
Support:
1. $69,240 — intracandle low from Mar 10 12:00 UTC session and recent pullback floor
2. $68,347–$68,404 — Mar 9 20:00 UTC swing low / demand zone
3. $66,710–$66,866 — multi-touch support from Mar 7–8 range lows
Resistance:
1. $70,482 — EMA 200, immediate overhead resistance (price currently testing)
2. $71,274–$71,767 — Mar 10 session highs / local swing high and current cycle top
3. $72,623 — 25x short liquidation cluster, likely to act as a magnet if $71,767 breaks
Chart Patterns
- V-shaped recovery / ascending channel: From the $65,571 low (Mar 8) price carved higher lows ($67,172 → $68,347 → $69,240) and higher highs, forming a rising channel with upper bound near $71,800 and lower trendline support around $69,200.
- Bear rejection candle at $71,767: The Mar 10 12:00 UTC candle printed a $2,528 range with a long upper wick closing at $71,325, followed by a sell-off — classic distribution signal at resistance suggesting a potential double-top if price retests and fails at $71,700–$71,800.
- Consolidation flag forming: The last two 4H candles ($70,025–$70,167) show sharply declining volume (2.4M vs 110M at the high), suggesting a tight bull flag between $69,700–$70,230 that resolves with the next volume impulse.
Liquidation Analysis
- Nearest clusters: 50x shorts at $71,219 (only $1,052 above) and 50x longs at $69,114 ($1,053 below) — tight squeeze zone with both sides vulnerable within ~1.5%.
- Cascade risk: A push above $71,219 triggers 50x short liquidations, potentially cascading into 25x shorts at $72,623 and 10x at $76,833 — a $6,600 upside wick risk if momentum sustains.
- Most at-risk group: High-leverage shorts (50x–100x) are most exposed; price is already above all short-term EMAs and approaching the 50x short liquidation level, with bullish MACD and rising OI fueling the move.
Funding Rate & OI Analysis
- Funding sentiment: Negative funding (-0.0095%) means shorts are paying longs — the market is net short-biased despite price rallying, creating a classic short squeeze setup.
- OI interpretation: OI rising +2.86% alongside a +1.73% price increase indicates new positions are being opened into the move — likely fresh shorts being added that could become fuel for further upside.
- Positioning bias: Persistent negative funding over the past 48h with rising price = shorts are fighting the trend. Positioning is contrarian bearish while price action is bullish — favors continued upside pressure.
News and Sentiment
- Fear & Greed at 13 (Extreme Fear): Despite price recovery to $70K, sentiment remains deeply fearful — historically a contrarian bullish signal when price is reclaiming key EMAs.
- Catalyst watch: Price sitting just below EMA 200 ($70,482) — a clean reclaim could trigger momentum buying and sentiment shift. No specific news available, but macro fear likely tied to broader risk-off conditions.
- Disconnect: The divergence between improving technicals (bullish MACD crossover, price above EMA 20/50) and extreme fear suggests retail is underpositioned for a potential squeeze higher.
Trade Setups
Setup 1: Long — EMA 200 Reclaim Breakout
Entry: $70,500 (on confirmed break above EMA 200) | Stop: $69,050 (below EMA 20) | Target: $72,600 (25x short liq cascade) | R:R: 1.45:1 | Leverage: 10x | Confidence: Medium
Setup 2: Long — Pullback to EMA 20 Support
Entry: $69,100 | Stop: $67,650 (below 25x long liq) | Target: $71,800 (recent high retest) | R:R: 1.86:1 | Leverage: 10x | Confidence: High
Setup 3: Short — Rejection at Recent High
Entry: $71,700 (rejection at 24h high) | Stop: $72,700 (above 25x short liq) | Target: $69,100 (EMA 20) | R:R: 2.6:1 | Leverage: 5x | Confidence: Low
Key Risks
- Cascade level: A break below $69,100 (EMA 20 / 50x long liq) could trigger long liquidation cascades down to $67,711 (25x) and accelerate selling toward $63,500.
- Funding risk: Negative funding currently benefits longs, but a sharp sentiment flip to positive funding on a breakout could signal overcrowding and a local top.
- Invalidation price: Bullish thesis invalidated below $67,700 (25x long liq + loss of EMA 50 at $68,692); bearish thesis invalidated above $72,623 (25x short cascade).
Summary
BTC is in a bullish short-squeeze setup — price above EMA 20/50, negative funding with rising OI, and extreme fear creating a contrarian tailwind. The critical level today is EMA 200 at $70,482: a sustained reclaim opens the door to $71,200–$72,600 via short liquidation cascades, while rejection here keeps price rangebound.
⚠️ AI-generated analysis for informational purposes only. Not financial advice. Futures trading involves significant risk of loss. Always use stop losses.