
| Price | $69,490.50 (▼ -1.98% 24h) |
| 24h High | $71,768 |
| 24h Low | $69,240 |
| EMA 20 | $69,199 |
| EMA 50 | $68,779 |
| EMA 200 | $70,452 |
| EMA Alignment | Mixed |
| Funding /8h | -0.0015% — Shorts paying Longs |
| OI Trend | Falling (-1.9%) |
| Fear & Greed | 15 – Extreme Fear (yesterday: 13 – Extreme Fear) |
Trend Analysis
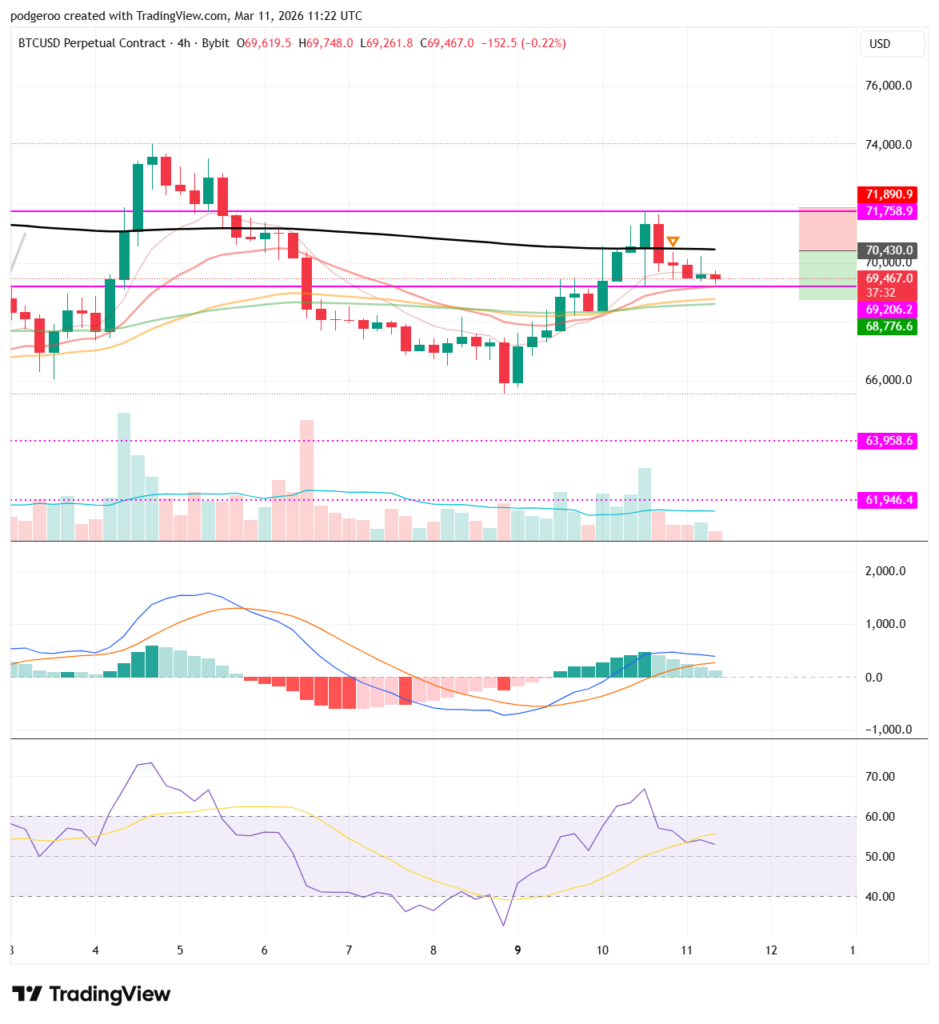
- Short-term bearish pullback within a broader recovery: Price rallied from ~$65,571 low (Mar 8) to $71,767 high (Mar 10) but has since sold off ~3.2%, printing lower highs over the last 5 candles.
- EMA stack is mixed/transitioning: Price ($69,490) sits above EMA 20 ($69,199) and EMA 50 ($68,779) but below EMA 200 ($70,452) — no clean bullish or bearish alignment; the 200 EMA is acting as a ceiling.
- Momentum fading: MACD histogram is decreasing (120.72, down from prior bars) despite still being in bullish crossover territory; RSI at 53 confirms loss of upside momentum. Negative funding + extreme fear suggest broader bearish sentiment despite the recent bounce.
EMA Analysis
- EMA 200 ($70,452) is the critical resistance: Price was rejected twice near this level (Mar 10 candles topped at $71,767 and $71,688 before reversing sharply). Reclaiming and holding above $70,452 is necessary for bullish continuation.
- EMA 20 ($69,199) is immediate dynamic support: Price is only 0.42% above it; a break below opens the path to EMA 50 ($68,779), which aligns with consolidation support from Mar 9.
- No bearish EMA crossover imminent yet, but if price continues drifting lower, EMA 20 will flatten and could cross below EMA 50 within 2-3 days, confirming a short-term bearish shift.
Support and Resistance
Support:
1. $69,199 – $69,240 (EMA 20 + 24h low)
2. $68,350 – $68,400 (Mar 9 swing low cluster + prior consolidation)
3. $67,170 – $67,300 (Mar 8 range midpoint, multi-touch demand zone)
Resistance:
1. $70,450 – $70,570 (EMA 200 + Mar 10 00:00 candle high)
2. $71,275 – $71,325 (Mar 10 08:00 close + structure)
3. $71,688 – $71,768 (24h high / swing high, double-top rejection zone)
Chart Patterns
- Double-top forming at $71,688–$71,768: Two rejections within the Mar 10 12:00 and 16:00 candles with a neckline near $69,240 (today’s low). A confirmed break below $69,200 targets ~$66,700.
- Descending staircase from the high: Sequence of lower highs ($71,767 → $71,688 → $70,385 → $70,243 → $69,741) over the last 6 candles suggests controlled distribution.
- Bull flag potential if $69,200 holds: The rally from $65,571 to $71,767 followed by a shallow pullback to the EMA 20 could resolve upward on a break above $70,450, targeting $73,000+. This is the less probable scenario given sentiment and declining OI.
Liquidation Analysis
- Nearest clusters: 50x shorts at $70,533 (just ~1.5% above) and 100x shorts at $69,838 (~$350 above) are the closest upside targets; 100x longs at $69,143 sit only ~$350 below current price, extremely tight.
- Cascade risk: A dip below $68,448 (50x long liq) could trigger a cascade through $67,058 (25x), accelerating a flush toward $62,889 — roughly 9.5% downside cascade zone.
- Most at-risk group: High-leverage longs (50x–100x) are in immediate danger with price just $350–$1,000 above liquidation; any continuation of the -1.98% daily move wipes them out.
Funding Rate & OI Analysis
- Funding sentiment: Negative funding (-0.0015%) with a persistently negative bias over the past 48h indicates shorts are dominant and paying longs — market is bearish-leaning but shorts are getting crowded.
- OI interpretation: OI falling -1.86% alongside price decline signals position unwinding/deleveraging rather than aggressive new short building — less conviction in the selloff.
- Positioning bias: Negative funding + falling OI = capitulation-style deleveraging. This often precedes a short squeeze or at minimum a relief bounce, especially with price still above key EMAs (20 & 50).
News and Sentiment
- Fear & Greed at 15 (Extreme Fear): Historically a contrarian buy signal zone; consecutive days at 13–15 suggest sentiment is near washout levels, but extreme fear can persist during trend breakdowns.
- No specific catalyst identified, but the macro picture of price holding above EMA20/50 while sentiment is at extreme fear creates a divergence that typically resolves with a bounce.
- EMA 200 resistance at $70,452 is the key overhead level — failure to reclaim it keeps the intermediate trend bearish.
Trade Setups
Setup 1: Long (Mean Reversion / Short Squeeze) | Entry: $69,200 (EMA20 tag) | Stop: $68,400 (below 50x long liq) | Target: $70,500 (EMA200) | R:R: 1.6:1 | Leverage: 5x | Confidence: Medium
Setup 2: Short (EMA200 Rejection) | Entry: $70,450 (EMA200 touch) | Stop: $71,000 (above structure) | Target: $68,800 (EMA50) | R:R: 3:1 | Leverage: 5x | Confidence: High
Setup 3: Long (Cascade Flush Buy) | Entry: $67,000 (25x long liq sweep) | Stop: $65,800 | Target: $69,200 (EMA20) | R:R: 1.8:1 | Leverage: 3x | Confidence: Medium
Key Risks
- Cascade level: Break below $68,448 opens a liquidation waterfall to $67,058 and potentially $62,889; this is the critical downside tripwire.
- Funding risk: Persistent negative funding could flip if a squeeze triggers, rapidly forcing short covers and creating volatility spikes in either direction.
- Invalidation price: A daily close above $70,533 (50x short liq) invalidates the bearish structure and likely triggers a squeeze toward $71,923–$72,000.
Summary
Price is consolidating between EMA20 support ($69,199) and EMA200 resistance ($70,452) with extreme fear sentiment creating contrarian long potential, but the intermediate trend remains bearish below the 200 EMA. The key level today is $70,450 (EMA200) — reclaim it and shorts get squeezed; reject and we likely test $68,400–$67,000.
⚠️ AI-generated analysis for informational purposes only. Not financial advice. Futures trading involves significant risk of loss. Always use stop losses.